Financial
Highlights

- (A) Adjusted EBITDA Reconciliation
-
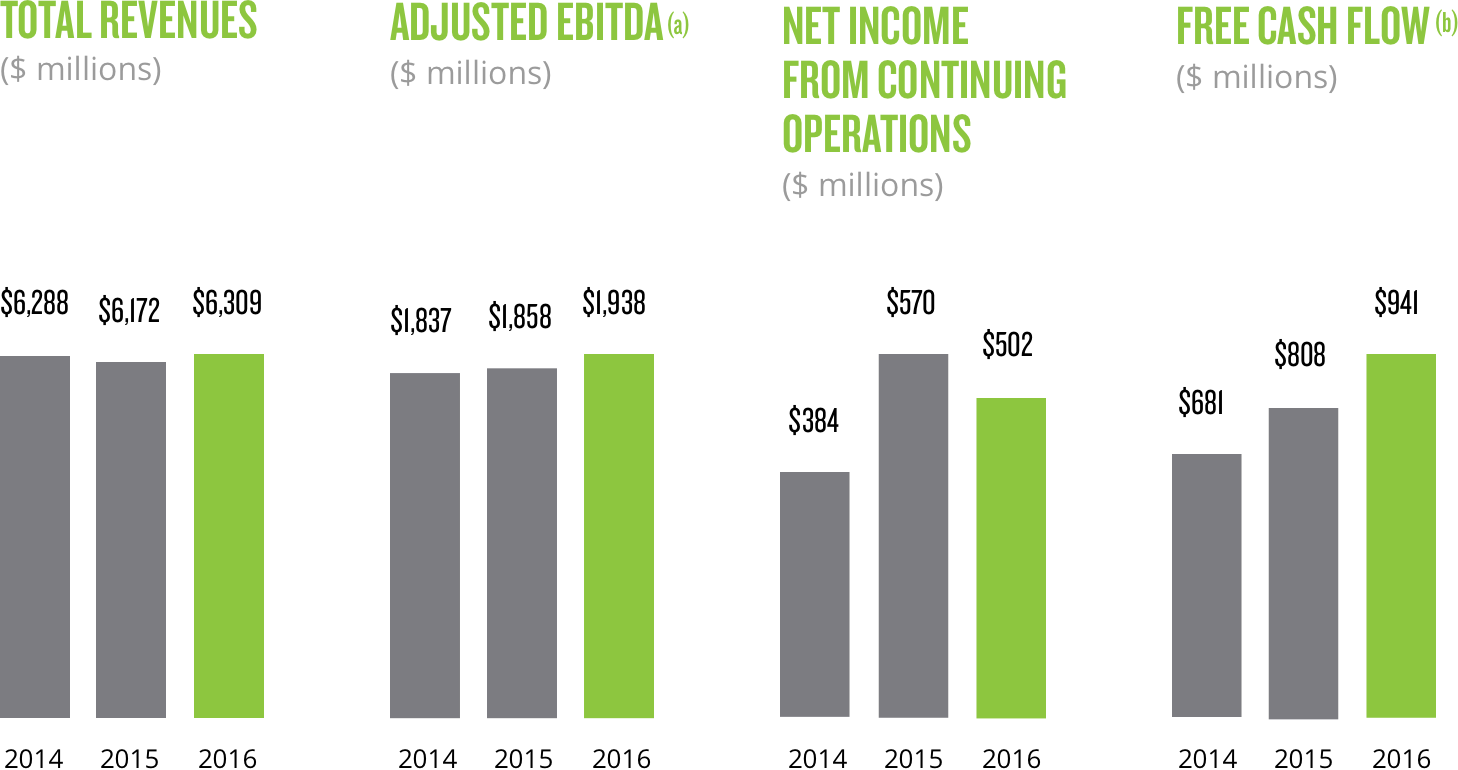
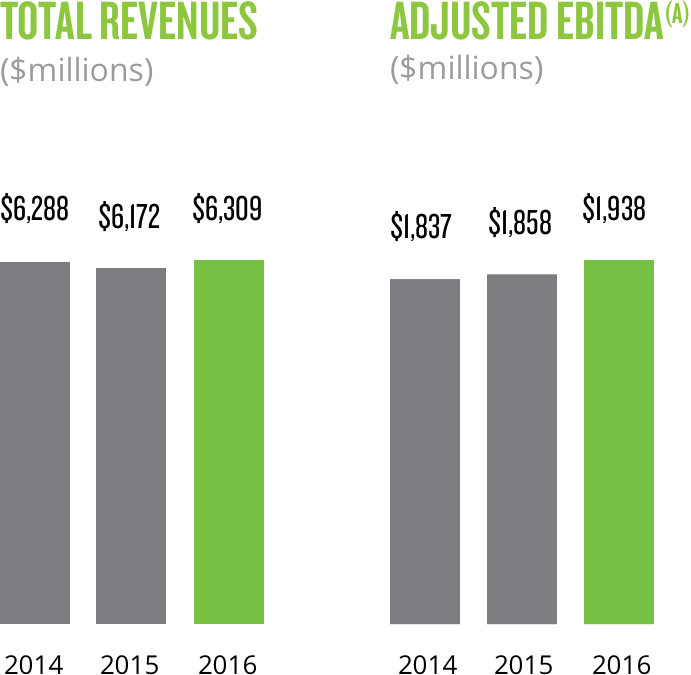
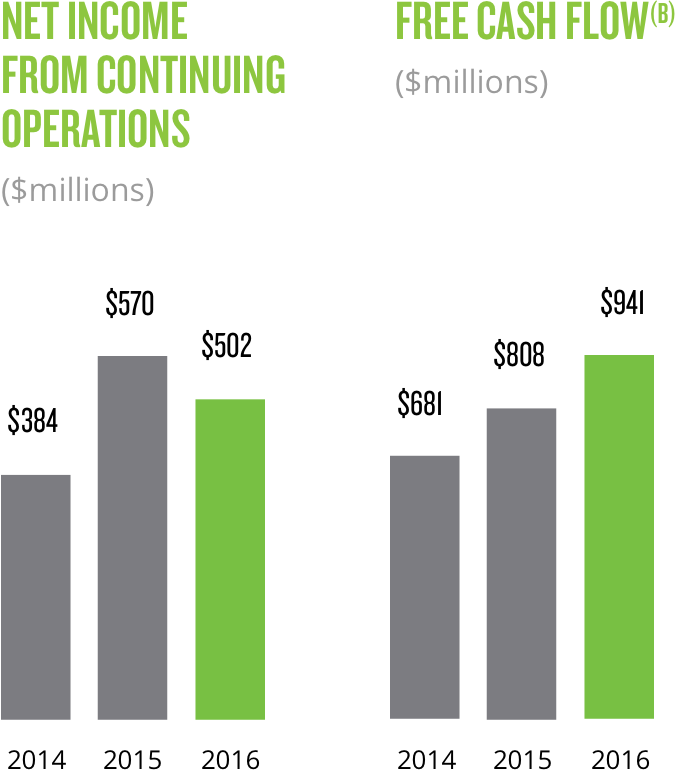
($ millions) 2016 2015 2014 Net income $502 $570 $384 Interest expense, net 329 307 297 Provision for income taxes 309 383 236 Depreciation and amortization 603 574 573 EBITDA 1,743 1,834 1,490 Equity in net loss of affiliates — 3 4 Other non-operating loss/(income), net 3 (170) 168 Restructuring charges 105 51 89 Stock-based compensation expense 51 48 47 Other items(a) 36 92 39 Adjusted EBITDA(b) $1,938 $1,858 $1,837 (a) For the year ended December 31, 2016 and 2014, other items primarily consist of business optimization costs. For the year ended December 31, 2015, other items consist of a $36 million donation to the Nielsen Foundation, $14 million charge for the partial settlement of certain U.S. pension plan participants, and business optimization costs.
(b) We define Adjusted EBITDA as net income or loss from our consolidated statements of operations before interest income and expense, income taxes, depreciation and amortization, restructuring charges, stock-based compensation expense and other non-operating items from our consolidated statements of operations as well as certain other items that arise outside the ordinary course of our continuing operations. We use Adjusted EBITDA to measure our performance from period to period both at the consolidated level as well as within our operating segments, to evaluate and fund incentive compensation programs and to compare our results to those of our competitors.
- (b) Free Cash Flow Reconciliation
-
($ millions) 2016 2015 2014 Net cash provided by operating activities $1,296 $1,209 $1,093 Non-recurring contribution to the Nielsen Foundation 36 Capital expenditures, net (391) (401) (412) Free Cash Flow(a) $941 $808 $681 (a) We define free cash flow as net cash provided by operating activities, plus contributions to the Nielsen Foundation, less capital expenditures, net. We believe providing free cash flow information provides valuable supplemental liquidity information regarding the cash flow that may be available for discretionary use by us in areas such as the distributions of dividends, repurchase of common stock, voluntary repayment of debt obligations or to fund our strategic initiatives, including acquisitions, if any. However, free cash flow does not represent residual cash flows entirely available for discretionary purposes; for example, the repayment of principal amounts borrowed is not deducted from free cash flow. Key limitations of the free cash flow measure include the assumptions that we will be able to refinance our existing debt when it matures and meet other cash flow obligations from financing activities, such as principal payments on debt. Free cash flow is not a presentation made in accordance with GAAP.
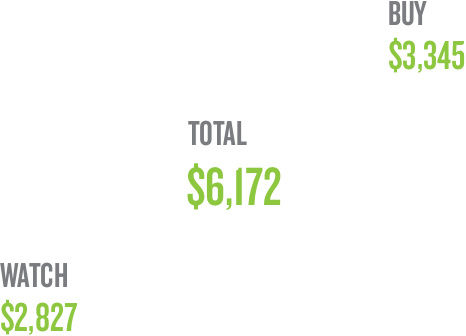
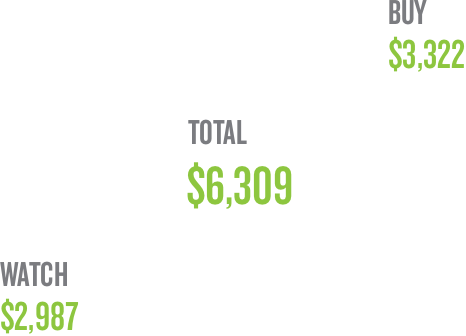
Annual Segment Revenues


Total Return Performance
The following graph shows a comparison of cumulative total shareholder return for our common stock, the Peer Group and the S&P 500. The comparison assumes that $100 was invested in Nielsen Holdings plc common stock and each of the indices over the period beginning on January 26, 2011 and ending December 31, 2016, and that dividends were reinvested.
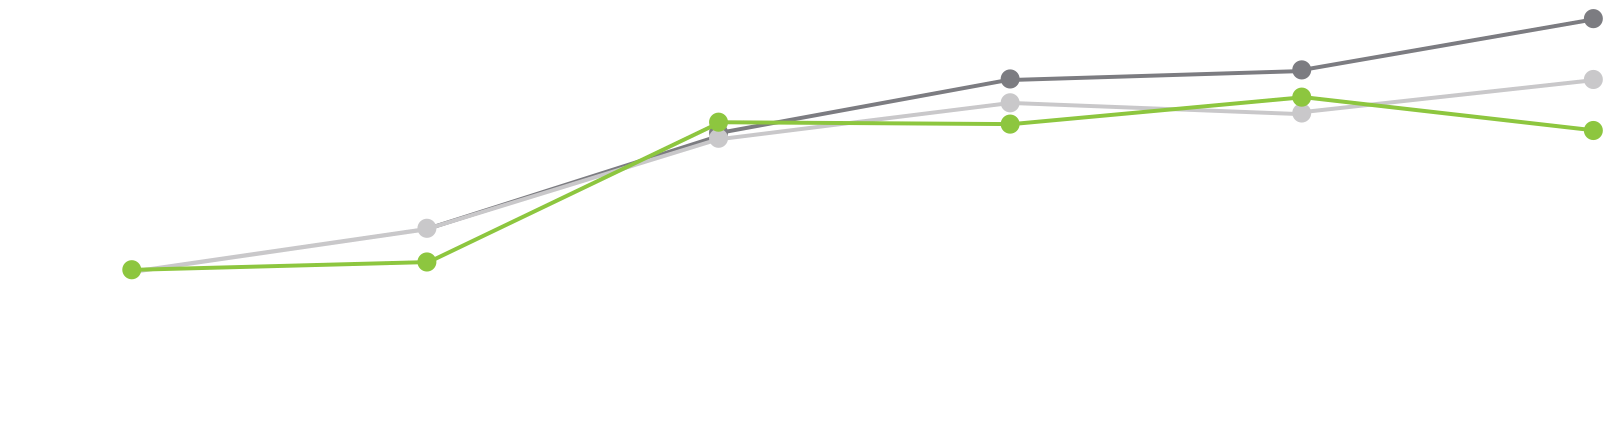

(c) The Peer Group includes companies in comparable businesses to Nielsen, as well as companies representing the markets we serve. The Peer Group is composed of Accenture plc, Coca-Cola Company, Colgate-Palmolive Company, Dun and Bradstreet Corporation, Equifax Inc., Experian plc, FactSet Research Systems Inc., GfK SE, IHS Markit Ltd., IMS Health Holdings, Inc. (now QuintilesIMS Holdings, Inc.), The Interpublic Group of Companies, Inc., McGraw Hill Financial, Inc. (now S&P Global, Inc.), Moody’s Corporation, MSCI Inc., Omnicom Group, Inc., The Procter & Gamble Company, RELX (NV) (formerly Reed-Elsevier), Thomson Reuters Corporation, Time Warner Inc., Twenty-First Century Fox, Inc., Unilever N.V. (ADR), Viacom Inc., Wolters Kluwer (NV/ADR), and WPP plc (ADR).